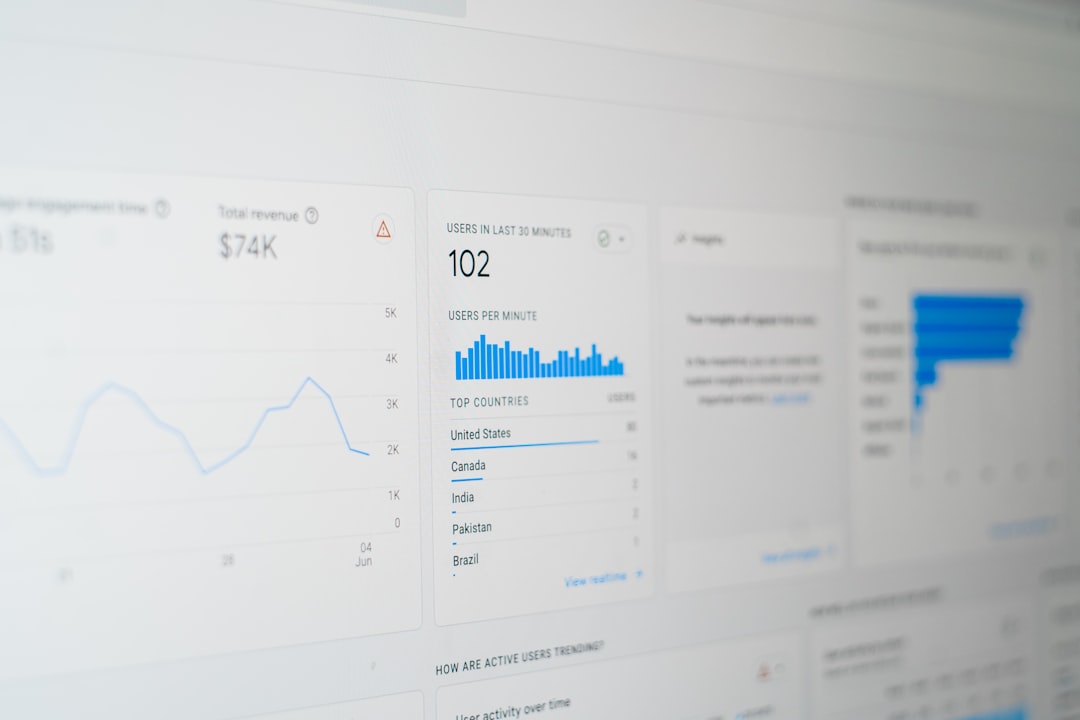
Build the table as a product feature, not as a UI afterthought. In a SaaS dashboard, the data table is often where users make decisions, approve work, spot risk, and export reports. McKinsey has reported that companies using customer analytics are far more likely to outperform peers in customer acquisition and profit growth [source: McKinsey]. That only helps if your interface makes the data clear, fast, and usable.
TLDR: Use shadcn/ui with TanStack Table to build serious React data tables for dashboards. Start with sorting, filtering, pagination, column visibility, row actions, and clean loading states. For example, a sales ops team reviewing 12,000 customer accounts can filter “at risk” accounts, sort by contract value, and assign follow-ups in under a minute instead of exporting CSV files. Keep the table predictable, accessible, and easy to scan.
Why shadcn/ui works well for SaaS tables
shadcn/ui is not a bulky component library. It gives you clean, copyable components built with Radix UI and Tailwind CSS. That matters for business software. You can own the code, adjust it, and keep the design consistent across reports, billing pages, admin panels, and customer lists.
The best setup is simple:
- React for the application.
- shadcn/ui for buttons, dropdowns, inputs, badges, menus, and table markup.
- TanStack Table for sorting, filtering, pagination, row selection, and state control.
- Tailwind CSS for spacing, color, density, and responsive rules.
The catch is that tables look easy until users ask for saved views, bulk actions, sticky columns, and export buttons. If you do not plan the structure early, small requests become messy fast.

Start with the data model
Before writing table UI, define what each row means. Is it a customer, invoice, order, ticket, or user account? Then define which fields users care about most.
A customer dashboard might need:
- Company name as the main identifier.
- Status shown with a colored badge.
- Monthly revenue formatted as currency.
- Health score shown as a number or label.
- Owner for accountability.
- Last activity for recency.
Do not show every field by default. That is how dashboards become noisy. Give users the top fields first, then let them reveal more columns if needed.
Use TanStack Table for real interaction
shadcn/ui gives you the visual pieces. TanStack Table gives you the logic. Together, they make a strong base for production software.
A practical column setup might look like this:
const columns = [
  {
    accessorKey: "company",
    header: "Company",
  },
  {
    accessorKey: "status",
    header: "Status",
  },
  {
    accessorKey: "mrr",
    header: "MRR",
  },
  {
    id: "actions",
    cell: ({ row }) => <CustomerActions customer={row.original} />,
  },
];
Keep render logic small. Put menus, badges, and action buttons into separate components. It makes the table easier to test and less painful to change later.
Add features business users expect
A serious dashboard table should support more than viewing rows. Users need to act on data.
- Sorting: Let users sort revenue, dates, risk scores, and usage counts.
- Filtering: Add text search and status filters. Keep them visible.
- Pagination: Use server-side pagination for large datasets.
- Column visibility: Let teams hide fields they do not use.
- Row selection: Support bulk edits, exports, and assignments.
- Row actions: Add menus for view, edit, assign, archive, or delete.
Honestly, it feels like many table tools forget that people use dashboards under pressure. A support lead does not want five clicks just to find overdue enterprise tickets. Good filters save real time.
Design for trust and speed
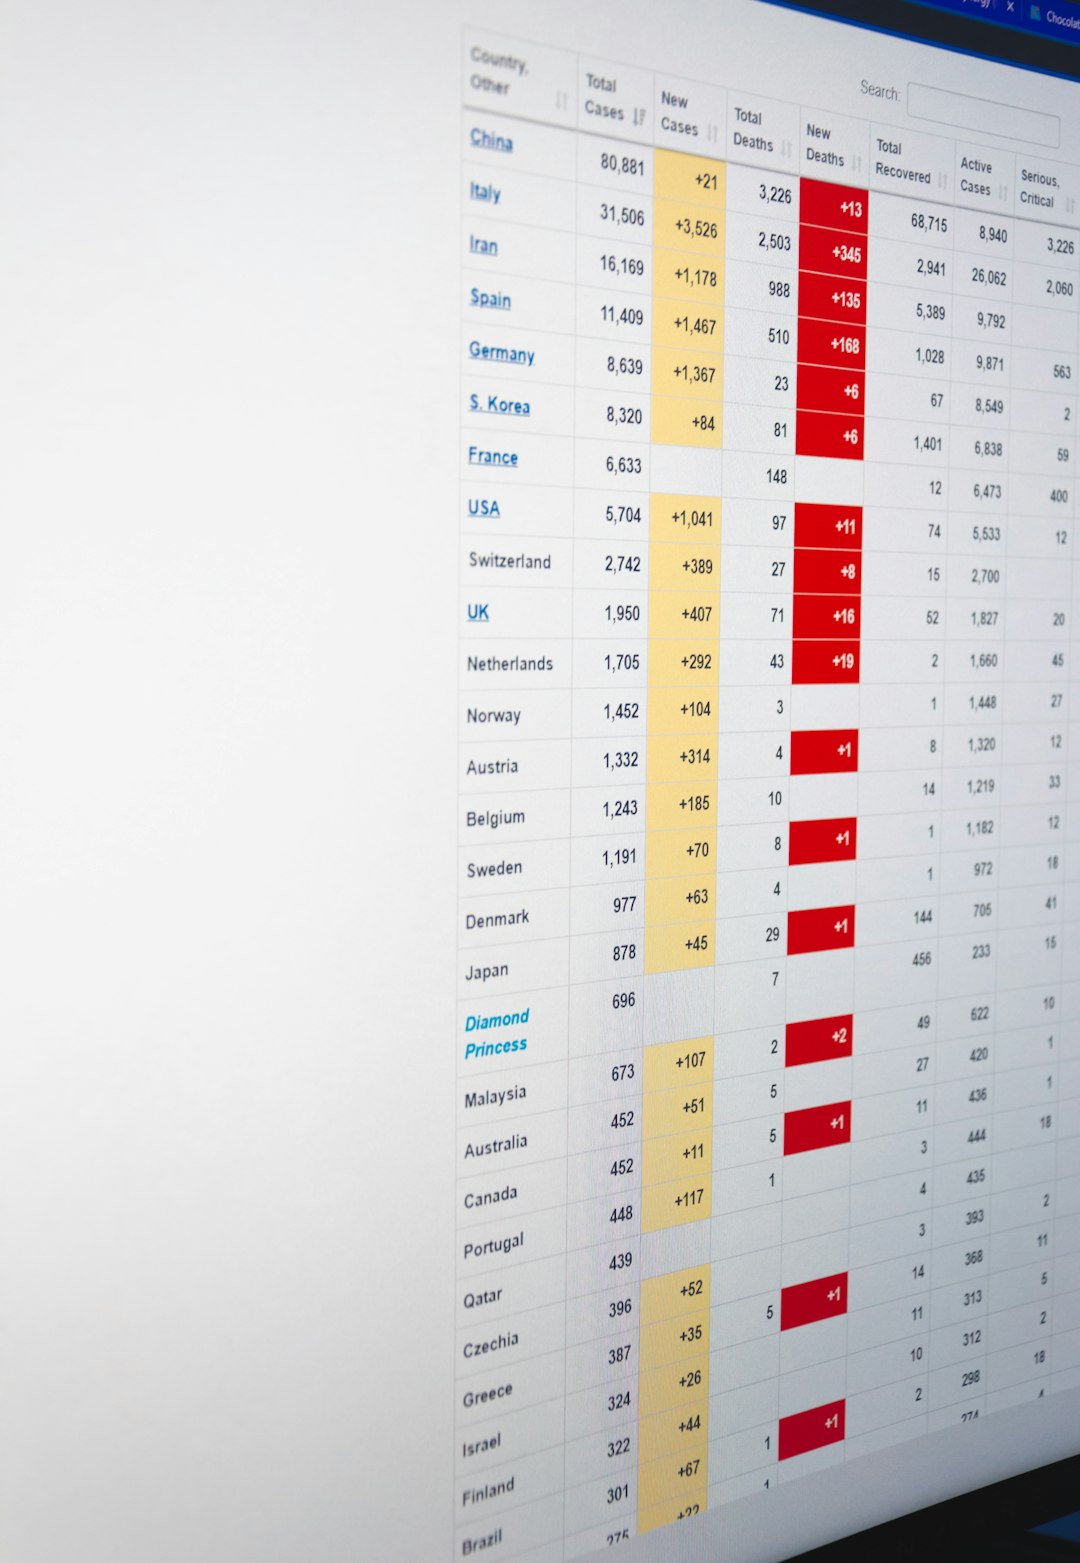
Business users notice small things. Bad alignment, jumpy loading states, and unclear labels make data feel less reliable. Use right alignment for numbers. Use clear date formats. Keep badges short, such as Active, Paused, At risk, and Trial.
Use skeleton loaders instead of blank tables. Show an empty state when no results match. Add a short message such as No accounts match these filters. Include a reset button. This avoids confusion.
For large tables, avoid loading every row in the browser. Use API parameters for page, limit, search, sort, and filters. A clean request might be:
/api/customers?page=2&limit=50&status=at-risk&sort=mrr.descThis keeps the interface fast. It also makes the backend easier to monitor.
Make the table fit the product
Not every SaaS table needs the same features. A finance table may need exports and audit trails. A CRM table may need bulk assignment. A usage table may need date ranges and account segments.
Ask these questions before shipping:
- What decision should this table support?
- Which columns are needed every day?
- Which actions must be available from each row?
- Should filters be saved per user?
- Does the table need role-based access?
Final build checklist
For a reliable React data table with shadcn/ui, ship the basics well before adding extras:
- Accessible controls with keyboard support.
- Server-side data handling for scale.
- Clear loading and empty states.
- Consistent formatting for dates, money, and percentages.
- Safe row actions with confirmation for destructive steps.
- Responsive behavior for smaller screens.
A good data table should feel boring in the best way. It should be fast, clear, and hard to misuse. With shadcn/ui and TanStack Table, React teams can build dashboard tables that support real business work without locking themselves into a rigid UI system.